What is PERT?

4 minute read    Updated:    Harwinder Singh

What is PERT (Program Evaluation and Review Technique)? What is PERT? (Part 3): In the previous article Three Point Estimate, we learned about the advantages of 3-point estimation. In this post, we’ll carry the concept forward and talk about a special type of three point estimation technique called Program Evaluation and Review Technique (PERT).

Three Point Estimates are better than a Single Fixed Estimate

After reading the previous article, can I say that we agree that three point estimates are better than a single fixed estimate? There’s a very little probability of completing a project on any one given date. Three-point estimates use 3 different estimates - Optimistic (O), Most Likely (M) and Pessimistic (P) - to estimate project duration and cost. Rather than using a single estimate, three-point estimates use a range of estimates. The three estimates take into consideration the risk in the project and help project managers develop a more realistic schedule or budget. For the purpose of planning, a single estimate is derived from the three-point estimates.

What is simple average three point activity duration estimate?

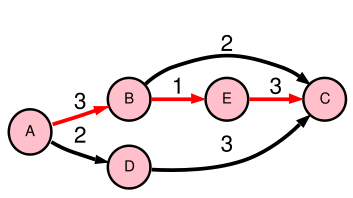
As a project manager, I go around to project team members, collecting 3-point estimates for all the activities on the network diagram. But wait a minute, in order to calculate the critical path using the Critical Path Method (CPM), I need to get a single fixed time estimate for each activity on the network diagram. If you are familiar with CPM, you know that the critical path is the path with the longest duration in the network diagram, and each activity in the network diagram has a fixed estimate. Therefore, we need to somehow convert the 3-point estimates for each activity to a single estimate.

Let’s take the example of Activity Duration Estimate.

If you use a “simple” average estimate for a project, you would take a mean of all the 3 estimates i.e. add up all the 3 estimates and divide them by three.

Simple average Duration Estimate = (O + M + P) / 3

where O is the Optimistic estimate, M is the Most likely estimate, and P is the Pessimistic estimate.

What is PERT?

PERT stands for Program Evaluation and Review Technique. PERT was developed jointly by the U.S. Navy, Lockheed Martin, and the consulting firm of Booz, Allen and Hamilton working on the Polaris nuclear submarine project, in the 1950s. PERT is one of the most commonly used techniques used along with Critical Path Method (CPM) to estimate the minimum time needed to complete a project.

PERT and CPM are two common techniques used for project duration estimation.

PERT is a "weighted" average duration estimation technique

PERT combines probability theory and statistics to derive a formula for the average (mean) activity duration from the three point estimates. PERT uses 1-4-1 weightage i.e. it gives 4 times more weightage to the Most likely (M) estimate than the Optimistic and Pessimistic estimates. The formula for PERT estimate is:

PERT estimate = (O + 4M +P) / 6

Note: PERT estimate is also known as the Expected Activity Duration or EAD or simply Expected Duration.

Summary

PERT is a type of three-point estimation technique. PERT uses a “weighted” average estimate rather than a simple average. Three-point estimates are also used for Monte-Carlo Analysis. In this next post in this series, we’ll learn how the PERT formula is derived and the underlying assumptions behind it.

Suggested Reading: It Takes Three to Make Good Estimates by Oliver F. Lehmann

If you have any questions, please post them in the comments section below. I would be happy to help.

8-part series on Project Estimation and PERT

  1. Get Intimate with PERT
  2. Three Point Estimate - The Power of Three in Project Estimation
  3. What is PERT? (you are here)
  4. The Magical PERT Formula
  5. Probability and Statistics in Project Management
  6. PERT and CPM get Cozy
  7. PMP Quiz Contest - Activity Duration Estimates
  8. Standard Deviation and Project Duration Estimates

Image credit: Wikimedia Commons

Leave a Comment

Loading...
Please select the checkbox

13 Comments

Missing Avatar

Sir,
I have few doubts about contigency reserves
1) Does it accounts for costs and time towards risk reponse action say time and cost towards making change in PM plan to avoid risks

2) is contingency reserve is just for residual risks.

Also another doubt is the way Project Schedule and Schedule Baseline been used.
Only Cost Management Process use schedule baseline whereas risk and quality process uses Project Schedule

Harwinder Singh Avatar

@ Anonymous:

I'm not clear about all the questions but I'll attempt to answer whatever I could understand.

1. The time and money spent to "plan" the risk response is not included in the contingency reserve. But, the time and money spent to respond to the risk (when it occurs), will be taken from the contingency reserve.

2. Yes, it's for residual risks - the risks that remain after risk response planning has been completed. Residual risks are "accepted" risk for which you make contingency or fallback plans. It would probably not be worth the effort to completely eliminate them.

I didn't understand your question about the schedule baseline.

Regards.

Missing Avatar

Thanks

Now my another doubt is
In the risk response there is a tool called "Contigency Response Strategies" whats the real significance of this tool coz there is already contigency plan in the risk register.

whats the real difference between Project Schedule and Schedule Baseline? why it is not redundant

Harwinder Singh Avatar

@ Anonymous:

1. Contingency Response Strategies identify the triggers that invoke the Contingency Plan.

Let's take the example of an air-conditioner. If you set the thermostat at 22 deg C, as soon as the room temperature drops below 22 deg C, the compressor will be turned off.

Therefore, 22 deg C is your event or trigger point. And the response is "turning off the AC".

In Contingency Response Strategies, we identify the event that needs to occur in order to invoke the contigency response plan. We don't identify the response plan here, but only the trigger.

Does it make sense now?

2. Your question about the difference between Project Schedule and Schedule Baseline is very good.

Schedule Baseline is an "approved" snapshot of a Project Schedule.

But you asked why are they not redundant. Again a good question.

Imagine that you have created a Project Schedule using MS Project during the planning phase. It is approved by the management. This approved version is the "Schedule Baseline". Now your first task got completed. Where do you go and log this activity completion? You open your Project schedule file (created in MS Project) and mark that activity as 100% complete. You also put the actual start and completion date, and the hours spent on the activity, in the file. Save the file and close it. Now the file you just updated is your "Project Schedule". This is where you track the "actual" progress. You don't touch the "Schedule Baseline".

Now going forward, you want to compare how your project is progressing in terms of schedule. How do you do that? You compare the Project Schedule (actual) to the Schedule Baseline (baseline) and look for variances.

Now do you see why you need both Project Schedule and Schedule Baseline?

In Summary:

Project Schedule ~ Actual
Schedule Baseline ~ Baseline

You compare the two to find variance.

Let me know if you still have questions.

Good luck.

Missing Avatar

Thanks. Your answers are really precise and simple to understand.

Now my new doubt is where risk register is
As per Head First (page 557) "The risk register is built into the Risk Management Plan. Updates to
the risk register are the only output of the Identify Risks process."
But i guess Risk register is part of project documents.

Harwinder Singh Avatar

Hello Preetham,

Sorry for the late response.

PMBOK Guide, Fourth Edition identifies Risk Register as a separate project document. Refer to Table A1, Appendix A of the Guide. It is no longer considered a part of the Risk Management Plan.

Whenever you have such doubts, refer to the PMBOK Guide. As far as the PMP Exam is concerned, PMBOK Guide is the Bible, and what it says overrules every other prep book.

Good luck.

Harwinder Singh Avatar

Hello Preetham,

I have a request for you. Please try to post your comments on articles related to your topic, so that others can benefit from our exchange too. If you can't find a matching article, you can simply post the queries on the PMP Study Notes page. It's my mistake that I've not made a page for general Q&A. I'm also learning with experience.

All your questions have been very good, and I really enjoyed answering them. Keep them coming !

Thanks.

Missing Avatar

Hello, thanks for all your articles that help clarifying several subjects. On this particular one, I believe it could be interesting to add that:
The so-called simple average is related to triangular probability distribution
The weighted average as per PERT is related to beta probability distribution

Both distribution being defined from the 3 parameters (O,M,P)

Regards
Anthony P.

Missing Avatar

For a triangular distribution, the mean and variance are calculated as follows:
Mean = (pessimistic + optimistic + most likely) / 3
Variance = [(optimistic - pessimistic)^2 + (most likely - pessimistic) * (most likely - optimistic)] / 18
For a beta distribution, the mean and variance are calculated as follows:
Mean = (pessimistic + 4*(most likely)+ optimistic) / 6
Variance = ((optimistic - pessimistic)/6)^2
In this example, the calculations were performed assuming a triangular distribution.

Thanks
Saurabh

Missing Avatar

variance SD NDT and float :
by beta dis V = ( o-p/6)^2 = SD
in NDT 68.2% chance for a mean duration 48 days with sd=4, activity will vary = 44 days to 52 days
and by variance formula if sd is 4 then activity will vary +/- 16 days means = 32 to 64 days.
which is correct answer, if this is single activity what is correct float.if i say it should be finished in 50 days.