· Harwinder Singh · PMP · 4 min read
The Magical PERT Formula
What is the PERT Formula and how is it derived? How is PERT estimate calculated? Learn about derivation of PERT formula, Standard Deviation Formula, and Variance Formula.
 PERT Formula (Part 4): We saw the formulas for PERT estimate, variance and standard deviation of an activity duration in study guides, and accepted them like Newton's three laws of motion. Did we try to figure out how those formulas were derived? Do we know the underlying assumptions? Is there a magic in these formulas that allows them to predict the outcome of something as unique as a project? Can these formulas predict the project outcomes accurately? Are these formulas actually being applied in the real world? We'll find some answers in this article and remaining in the upcoming ones. But please be forewarned - if you are math-averse, this stuff may divide your head by zero!
Assumptions in PERT
In Say Hello to PERT, we learned that PERT estimate is a weighted average (mean) of the 3-point estimates. In order to get the mean of the 3-point estimates, PERT makes several assumptions and approximations.
The first assumption is that an activity’s completion time is a random variable, with clearly defined end points i.e. the completion time lies within a finite range. The minimum value of the range is the Optimistic (O) estimate and the maximum value is the Pessimistic (P) estimate. In other words, there’s no probability of the activity duration being less than O or more than P.
Beta Distribution
This assumption fits the definition of a Beta distribution. A beta distribution is a continuous probability distribution curve within a finite range. The peak of the curve is the mode (M, Most Likely value) of the distribution. A beta distribution is determined by 4 parameters - a minimum value, a maximum value and two shape parameters.
- a - Min value
- b - Max value
- α - Shape parameter
- β - Shape parameter
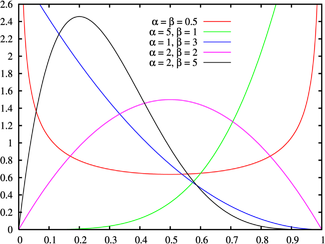
The two shape parameters α and β determine the shape of the beta distribution curve on the left and right of the mode (peak of the curve) respectively. We get a symmetric curve when the two shape parameters are equal. Refer to the following image (source: Wikipedia) that shows 5 different samples of beta distribution between the range of 0 and 1 (a = 0 and b = 1). Note: The case where a = 0 and b = 1 is known as the standard beta distribution.
Derivation of formulas for Mean, Variance and Standard Deviation
The mode, mean and variance of the beta distribution can be determined by the following 3 equations, where σ is the standard deviation:
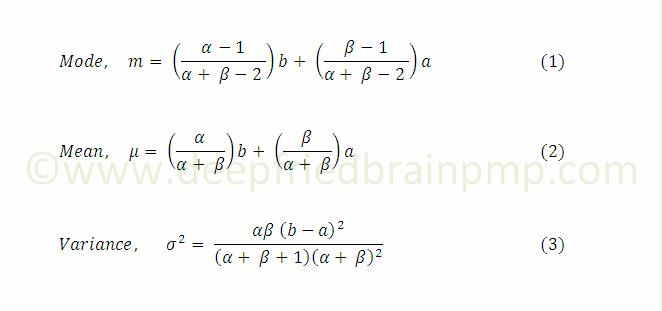
Let me clarify that we have switched the variables above. O has been replaced with a, the minimum value, P with b, the maximum value, and M with m, the mode.
As it turns out, the magical PERT formula is only true when the following assumptions are applied:
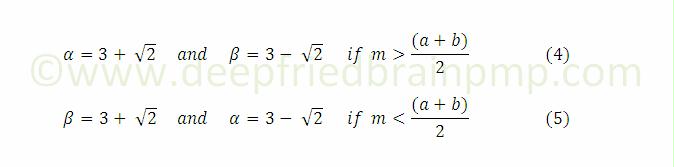
Equation (4) means that the curve is skewed toward the right, and (5) means it’s skewed toward the left. Substituting the value of α and β from either (4) or (5), we can solve equations (1), (2) and (3) to get the values of mean, variance and standard deviation of the distribution.
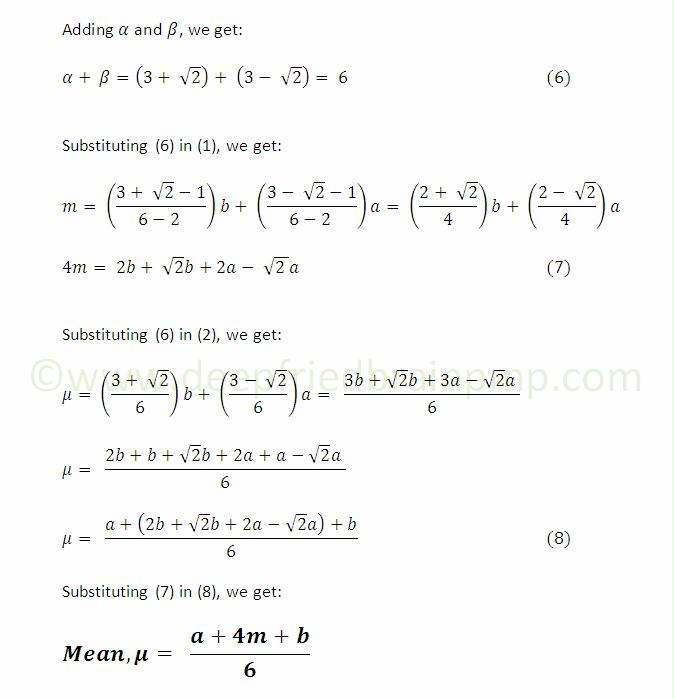
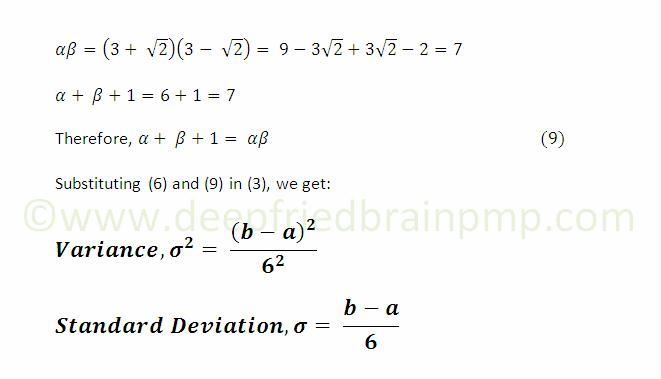
So, there we have it - the magical formulas of PERT and standard deviation. Two interesting observations from these formulas are:
- PERT gives 4 times more weightage to the mode or the Most Likely estimate.
- The difference between the maximum (Pessimistic) and the minimum (Optimistic) values is the uncertainty in the estimate, and is equal to six standard deviations, i.e.
Uncertainty = P - O = 6σ => σ = (P - O) / 6
As noted above, these formulas are accurate only for specific values of α and β. These values are rarely true in practice. In follow-up articles, I’ll discuss the problems with the assumptions and approximations, and the limitations of PERT in detail. Stay with me. We are just warming up.
8-part series on Project Estimation and PERT
- Get Intimate with PERT
- Three Point Estimate - The Power of Three in Project Estimation
- What is PERT?
- The Magical PERT Formula (you are here)
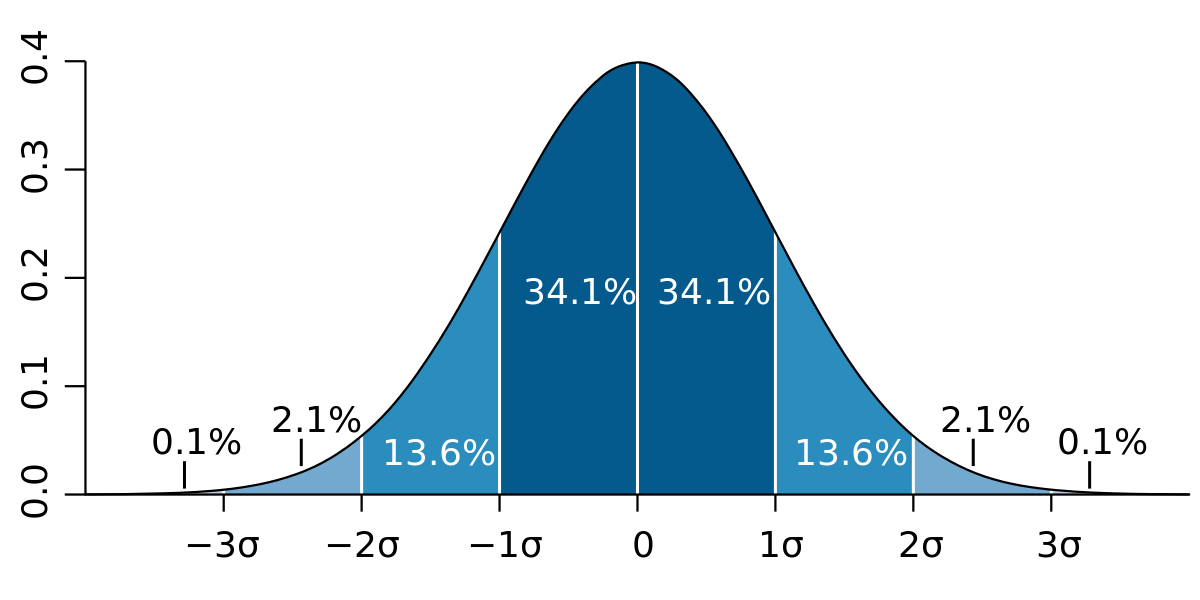
- Probability and Statistics in Project Management
- PERT and CPM get Cozy
- PMP Quiz Contest - Activity Duration Estimates
- Standard Deviation and Project Duration Estimates
Image credit: Flickr / acidwashphotography | Wikimedia Commons
- Study Notes
- PERT
- Standard Deviation
- Earned Value Management (EVM)
- PMP Formulas
- Estimation
- Schedule Management
6 Comments
Moderated — submissions appear after approval.
- Sreekanth imported
Simple and Understandable Sir.
- Harwinder Singh imported
Thanks for the feedback, Sreekanth. Now I know that at least one person read it :)
- Fawzia imported
Thank you for all your posts (yes I've been reading them as well). I've been teaching PM for 2 years now and this is the first time I've been able to grasp PERT and CPM together. You're doing such a fabulous job that I told me students to come to your blog. Thanks again.
- Harwinder Singh imported
That's a great compliment, Fawzia. Thank you so much.
- Saqlain
Usually, studying math divides my brain by 0, but this blog divided my brain by 1 and retained all the information. Thanks keep doing the great work.
- Harwinder Singh
Glad to hear that, Saqlain :) Thank you!


