Standard Deviation and Project Duration Estimates

Project Estimation and PERT (Part 8): Standard deviation is a statistical concept that gives a measure of the ‘spread’ of the values of a random variable around the mean of a distribution. It shows how much variation there is from the average or the mean value. The more the variation, the more the uncertainty or risk in the process. In the article Probability and Statistics in Projects, we learned that PERT assumes that the expected duration of the project follows the normal distribution. By calculating the PERT estimate (mean) and standard deviation of the project duration estimate, we can calculate the probability of completing the project within a given duration. How that works is explained in this article.
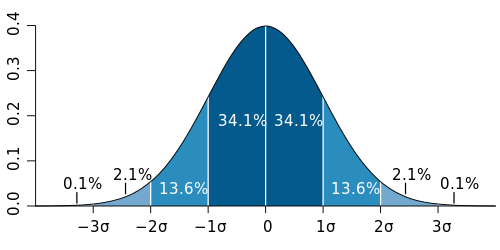
PERT assumes that the expected duration of a project follows the normal distribution. The normal distribution curve is a bell-shaped curve, and is symmetrical on both sides of the mean. A picture is worth a thousand words. Refer to the image above and you’ll get a better idea.
For the normal distribution, statistics say that there is:
- 68.2% probability that the data points will fall within one standard deviation of the mean. The dark blue portion represents the area within one standard deviation of the mean (-1σ, +1σ). Interestingly, this area is 68.2% (~ 34.1% + 34.1%) of the total area under the curve.
- 95.5% probability that the data points will fall within two standard deviations of the mean. The medium and dark blue portions combined represent the area within two standard deviations of the mean (-2σ, +2σ). This area is 95.5% (~ 13.6% + 34.1% + 34.1% + 13.6%) of the total area under the curve.
- 99.7% probability that the data points will fall within three standard deviations of the mean. The light, medium, and dark blue portions combined represent the area within three standard deviations of the mean (-3σ, +3σ). This area is 99.7% (~ 2.1% + 13.6% + 34.1% + 34.1% + 13.6% + 2.1%) of the total area under the curve.
For the normal distribution, we can determine the probability of the data points falling within any two points a and b on the curve by calculating the percentage area under the curve between those two points.
The peak of the curve is the mean or central value of the distribution. 50% of the area under the curve falls on the left side of the mean (below the mean) and the remaining 50% falls on the right (above the mean). Therefore, we can say that there’s 50% probability that the data points will fall below the mean, and another 50% probability for them to be above the mean.
Let’s say the PERT estimate (mean) of the project is 48 days and the standard deviation is 4 days. From what we have learned so far, there is:
- 50% probability that the project will complete within 48 days (mean).
- 68.2% probability that the project will complete between 44 to 52 days (one standard deviation of the mean).
- 95.5% probability that the project will complete between 40 to 56 days (two standard deviations of the mean).
- 99.7% probability that the project will complete between 36 to 60 days (three standard deviations of the mean).
Now if we want to know the probability of completing the project within say 44 days, all we need to do is to determine the area on the left side of 44 days on the curve. We know that 44 days represents -1σ on the curve. From the figure, we can tell that the area under the curve on the left side of the mean (μ) is 50% of the total area, and the area between -1σ and μ is 34.1%. Therefore, the area on the left side of -1σ is 15.9% (~ 50% - 34.1%). So, the probability of completing the project within 44 days is 15.9%.
Similarly the probability of completing the project within 52 days is 84.1% (~ 50% + 34.1%). And the probability of the project taking more than 60 days for completion is 0.1% (~ 100% - 50% - 34.1% - 13.6% - 2.1%).
Answers to Activity Duration Estimate Quiz
I hope with this explanation, you can answer most of the questions on the Activity Duration Estimate Quiz visually. Here are the answers to the quiz questions:
- Answer D: Project B has more risk than Project A Explanation: More standard deviation indicates more uncertainty or risk.
- Answer D: 50% Explanation: Refer to the article above for a detailed explanation.
- Answer A: 44 days to 52 days Explanation: Duration estimate 'range' is considered to be PERT estimate plus/minus one standard deviation.
- Answer B: 40 days to 56 days Explanation: 95% confidence level means PERT estimate plus/minus two standard deviations. Refer to the article above for a detailed explanation.
- Answer C: 84.1% Explanation: Refer to the article above for a detailed explanation.
- Answer C: 34.1% Explanation: Refer to the article above for a detailed explanation.
- Answer D: 15.9% Explanation: Refer to the article above for a detailed explanation.
- Answer A : 0.1% Explanation: Refer to the article above for a detailed explanation.
- Answer B: Beta Distribution Explanation: PERT assumes that individual activity duration estimates follow the Beta Distribution whereas the complete project duration estimate follows the normal distribution. Refer to the series on PERT estimation for a detailed explanation.
- Answer A: Fast-tracking the project Explanation: The activity has a expected duration of 10 days and a variance of 25 or a standard deviation of 5 days. This indicates a significant uncertainty or risk in the activity. Fast-tracking usually adds more risk. Option B is a potential way to transfer the risk, option C to eliminate, and option D to mitigate.
Thanks to all who participated in the quiz. I’m quite encouraged by the response. I welcome your comments and suggestions.
8-part series on Project Estimation and PERT
- Get Intimate with PERT
- Three Point Estimate - The Power of Three in Project Estimation
- What is PERT?
- The Magical PERT Formula
- Probability and Statistics in Project Management
- PERT and CPM get Cozy
- PMP Quiz Contest - Activity Duration Estimates
- Standard Deviation and Project Duration Estimates (you are here)
Image credit: Flickr / Wikimedia
14 Comments
Sreekanth
Harwinder Singh
Minsky
Neel
Gabor - Hungary
Anonymous
SSPAWAR
sumit
Anonymous
Viveksingh Thakur
Harwinder Singh
Anonymous
Eric Uyttewaal
Harwinder Singh